Parent Survey Application
SE Applications Dashboard
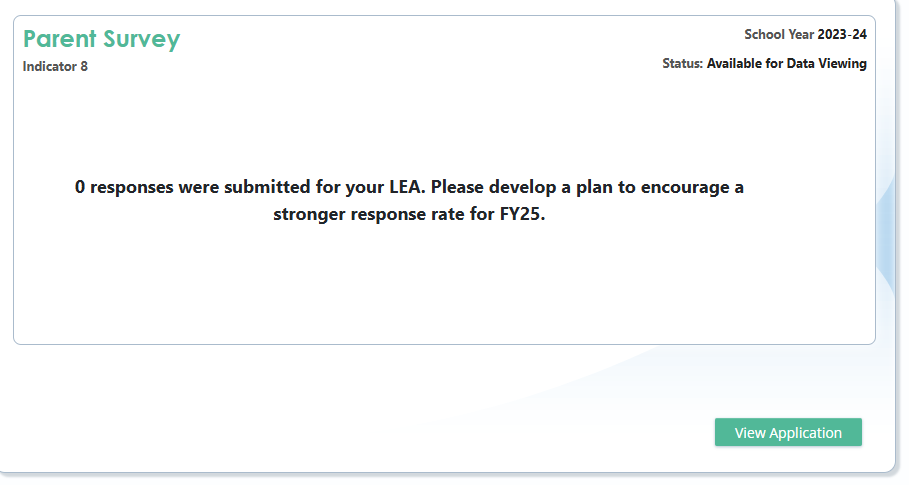
While on the SE Applications Dashboard, scroll down to the Parent Survey tile. Until the survey opens in January, it will reflect last year’s data. If you had 0 respondents, the tile shows, “0 responses were submitted for your LEA. Please develop a plan to encourage a stronger response rate for FYXX.”
Screenshot of a LEA with 0 responses
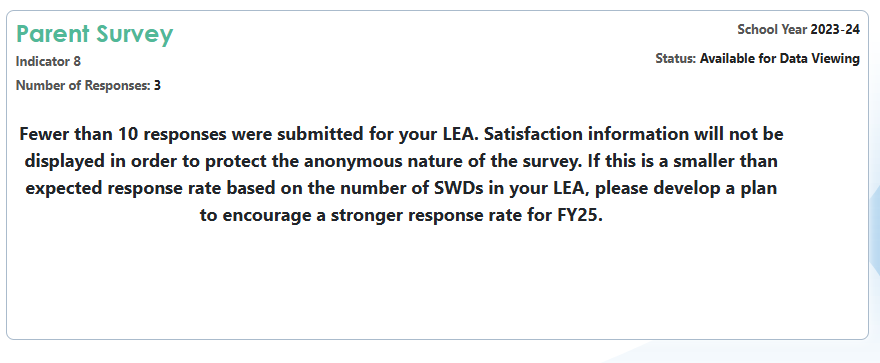
If your LEA had fewer than ten responses, the tile shows, “Fewer than ten responses were submitted for your LEA. Satisfaction information will not be displayed to protect the anonymous nature of the survey. If this is a smaller-than-expected response rate based on the number of SWDs in your LEA, please develop a plan to encourage a stronger response rate for FYXX.”
Screenshot of a LEA with less than 10 responses
LEAs are encouraged to engage as many parents as possible with the survey. Ideally, the response rate should match the demographic representation of the students with disabilities population in your LEA. For many LEAs with a small sample size, the completed sample size is insufficient for their survey results to be interpreted with a high degree of confidence.
Parent Mentors may be utilized to implement strategies that increase response rates and representation. Some examples include:
- Bringing an electronic device with the link to the survey preloaded to IEP meetings.
- Providing paper copies with the link or a QR code.
- Monitoring the live data in the Parent Survey Application.
- Providing access to the survey at schoolwide events.
- Assisting families with limited access.
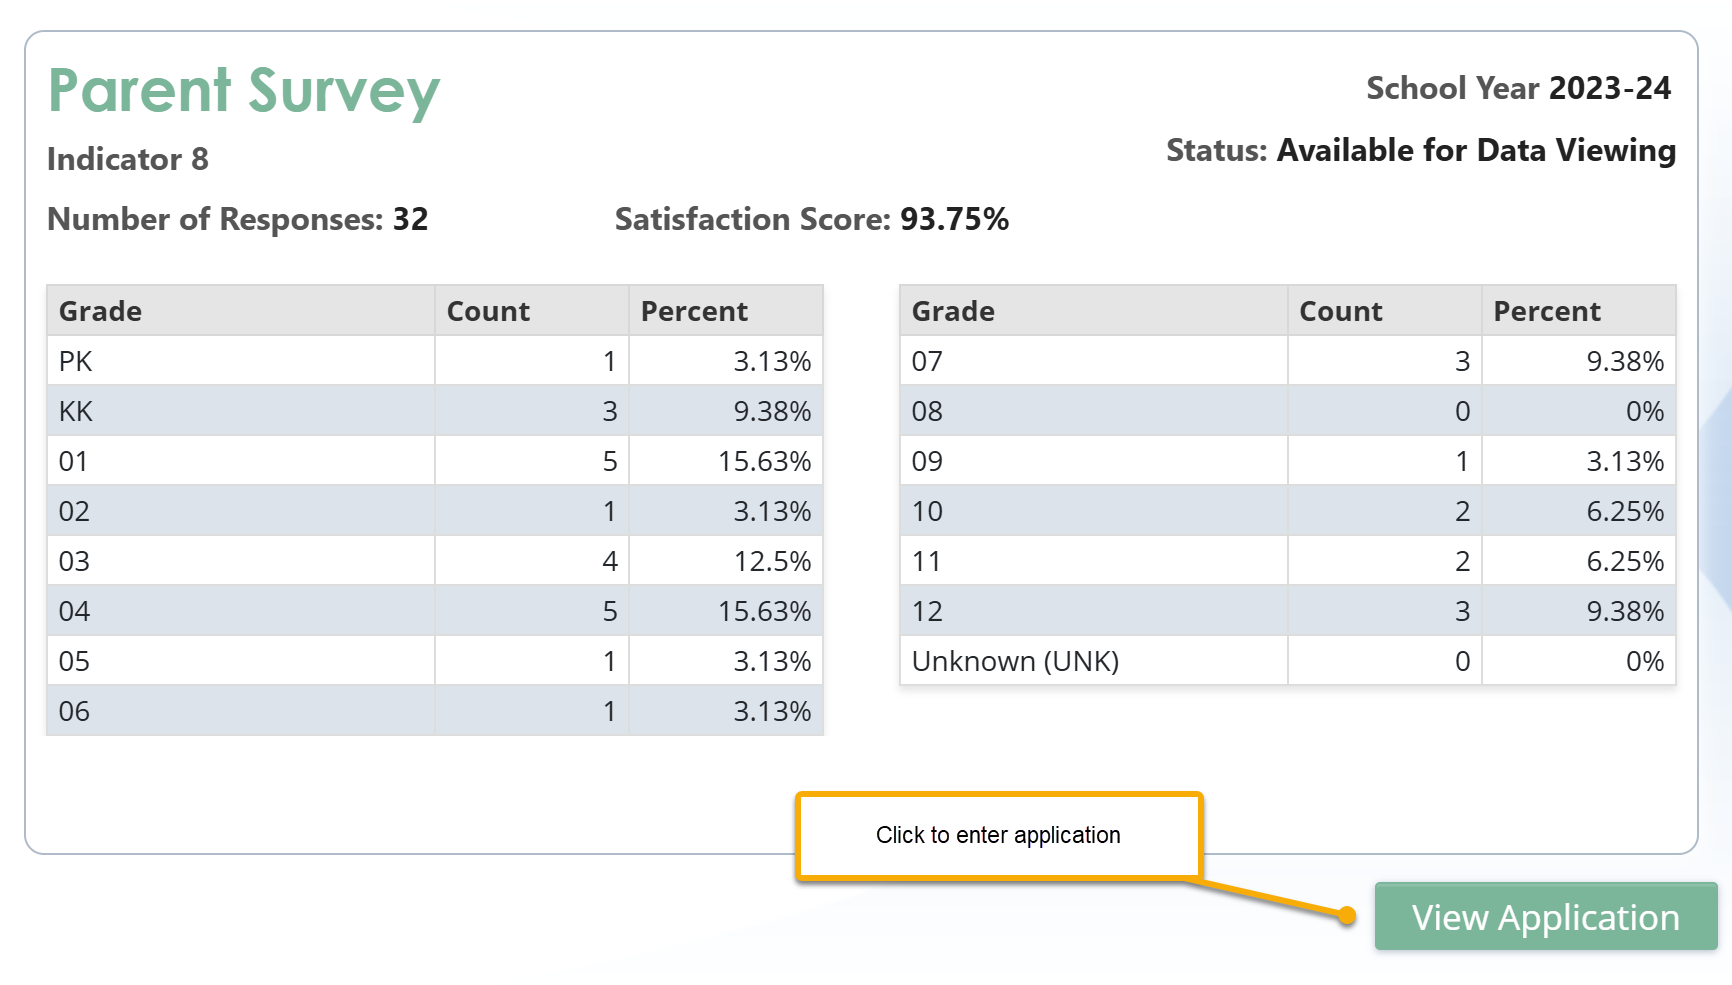
If the LEA received more than ten responses, the tile would show the number of responses per grade level and the percentage of all responses that were submitted for that grade.
When the survey opens in January, the message on the tile will change to “No Responses Found” until responses are submitted and loaded into the application. The LEA’s survey results will begin to populate when parents submit the survey. The data is “live” and is refreshed hourly. The LEAs should monitor the data regularly to ensure representative results.
LEAs can see parent’s perceptions of their efforts to partner with them to provide services and support for their child. Frequent monitoring and implementing strategies to address areas of weakness can result in a stronger satisfaction rate at the end of the survey period.
Screenshot shows the Parent Survey Tile in SE Applications Dashboard summarizing percent of parent responses by grade once the survey closes.
Response Summary Tab
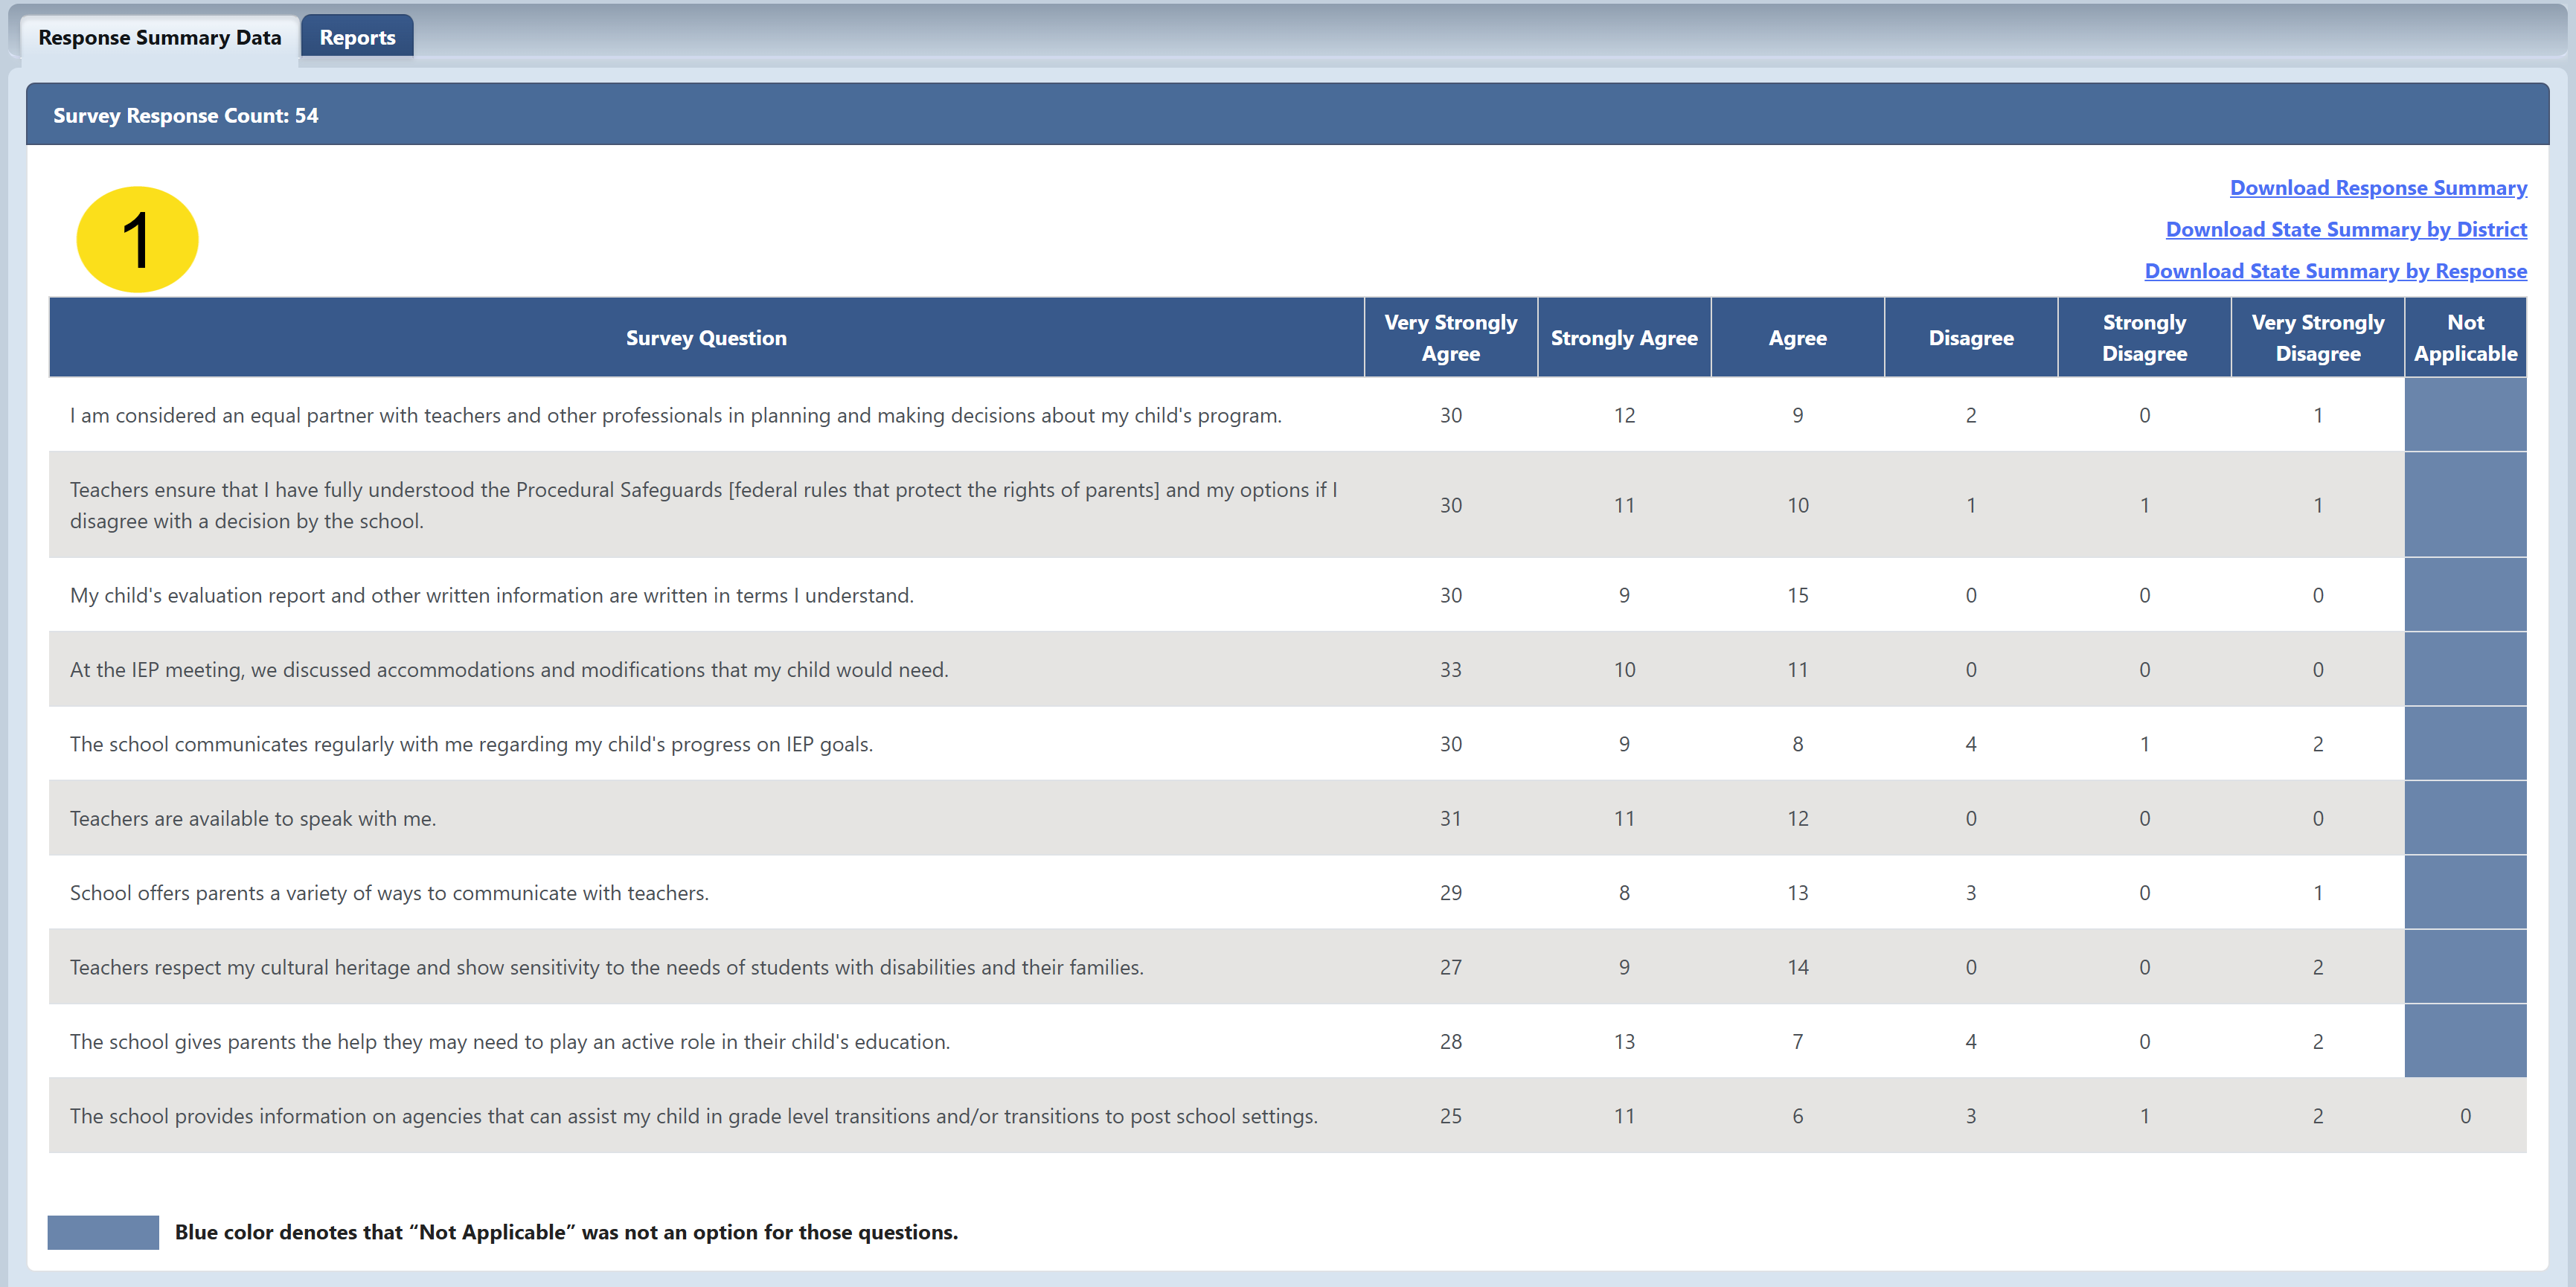
After selecting the View Application link from the dashboard, you will see two tabs: the Response Summary Data tab and the Reports Tab. The Response Summary Data tab will be open and have two sections. The first section, Survey Question Results (1), summarizes the parent responses by question and satisfaction level. The total number of responses for each question will not always be the same because some respondents will not answer all questions.
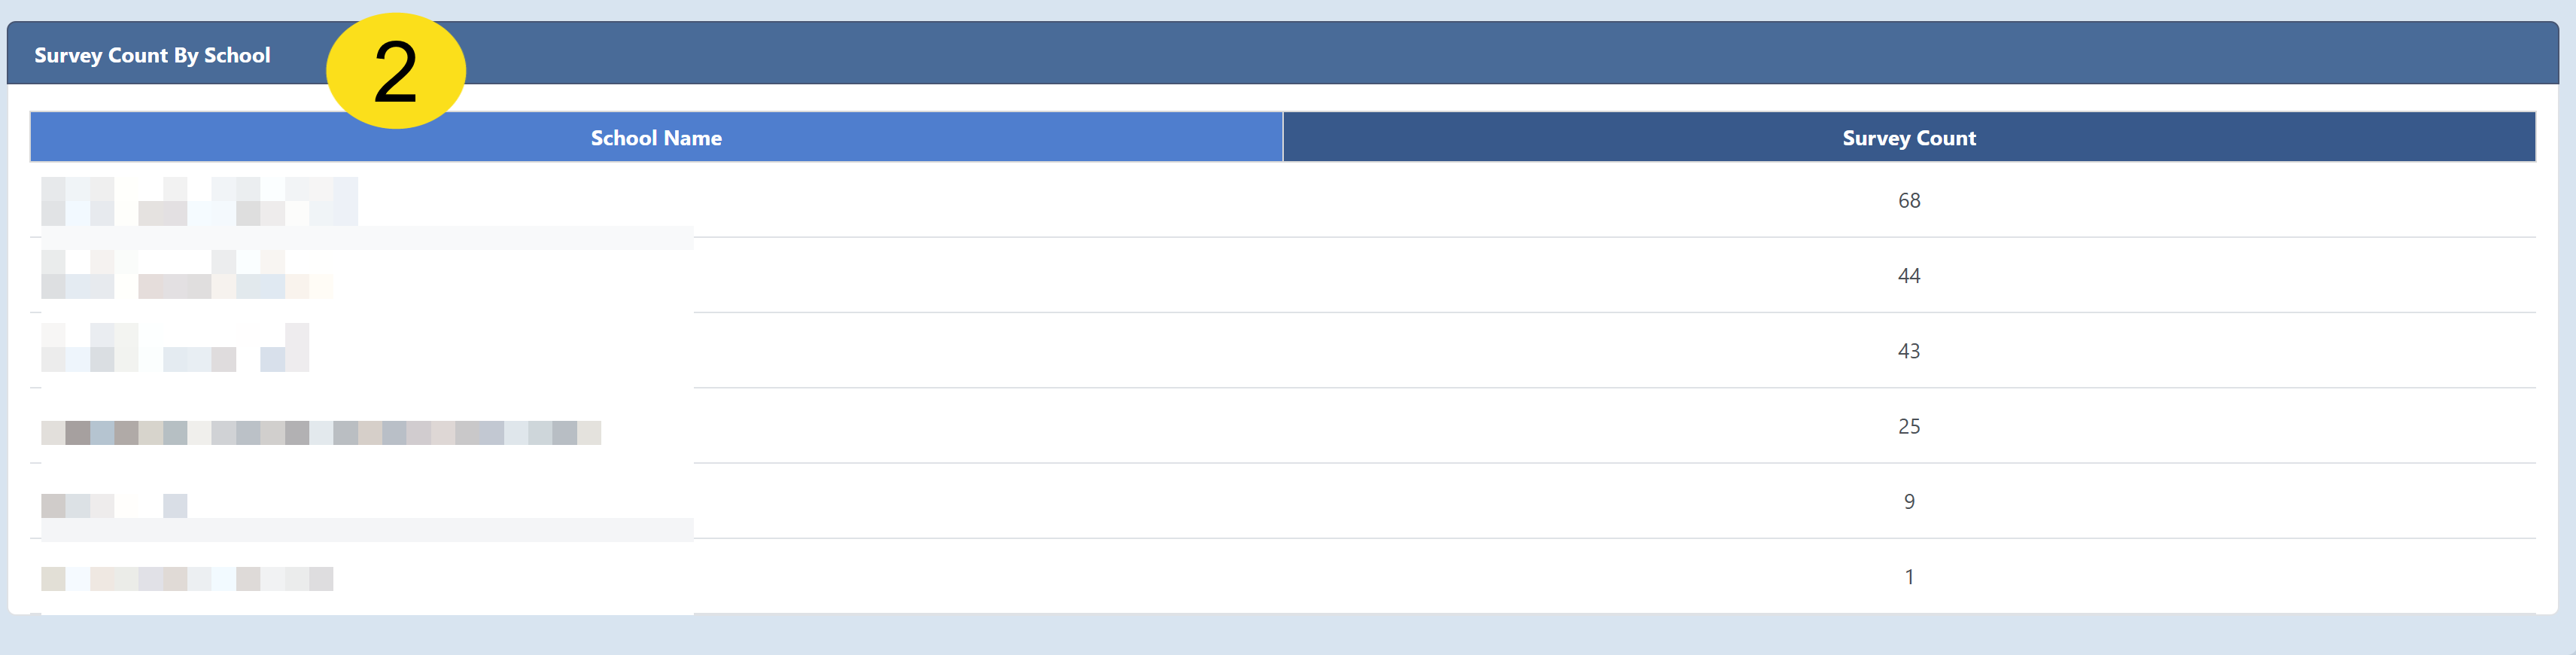
The second section shows the Survey Count by School (2). Each school in the LEA is listed, along with the number of surveys submitted for that school. The blue highlighted fields indicate that “Not Applicable” was not an option for that question.
Screenshot of Response Summary Data inside of the application
Screenshot of the Survey Count by School
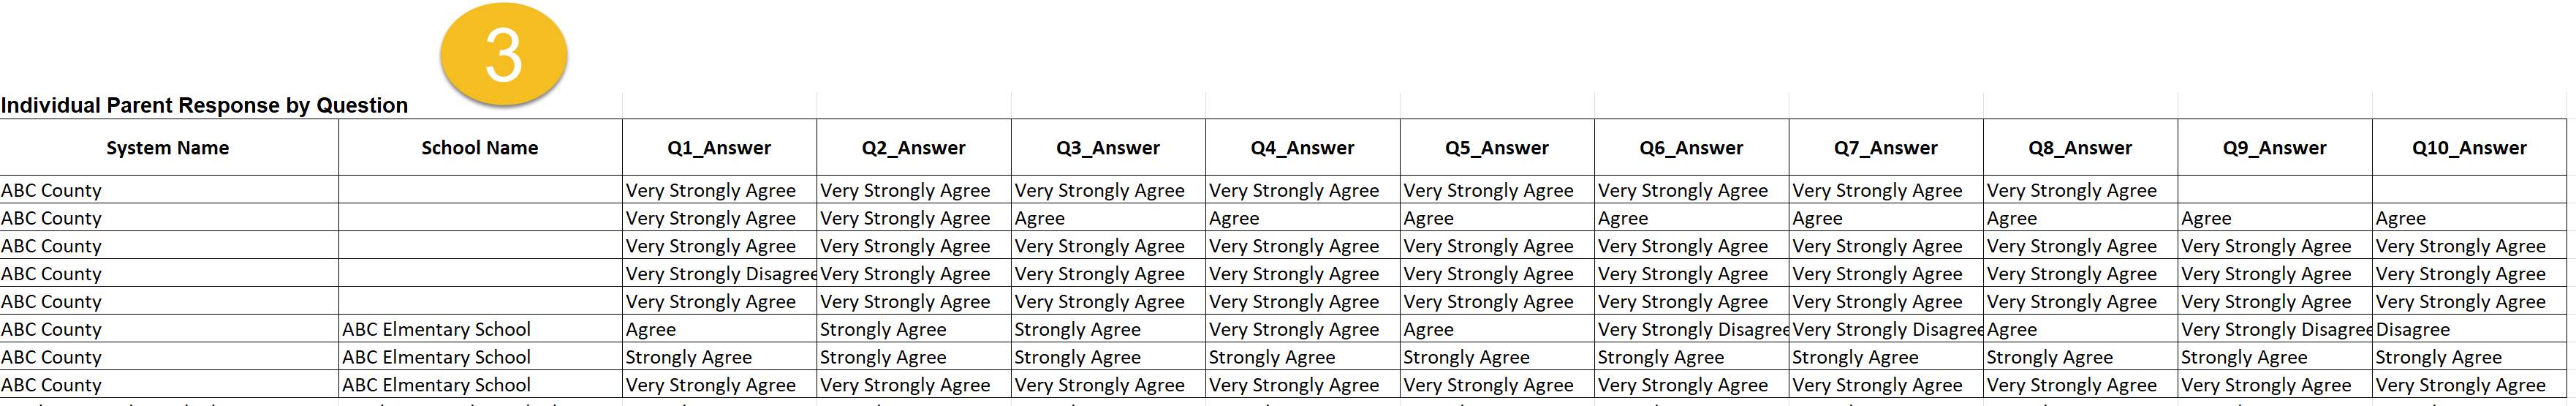
You can also select from 3 options for downloading reports. The Download Response Summary (3) has a line for each survey submitted. The school's name is a required field beginning with the FY25 submission, but historical data may have some lines with no school name. The file will also show the satisfaction rating provided for each question. Below is a screenshot of the summary file.
Screenshot of Response Summary
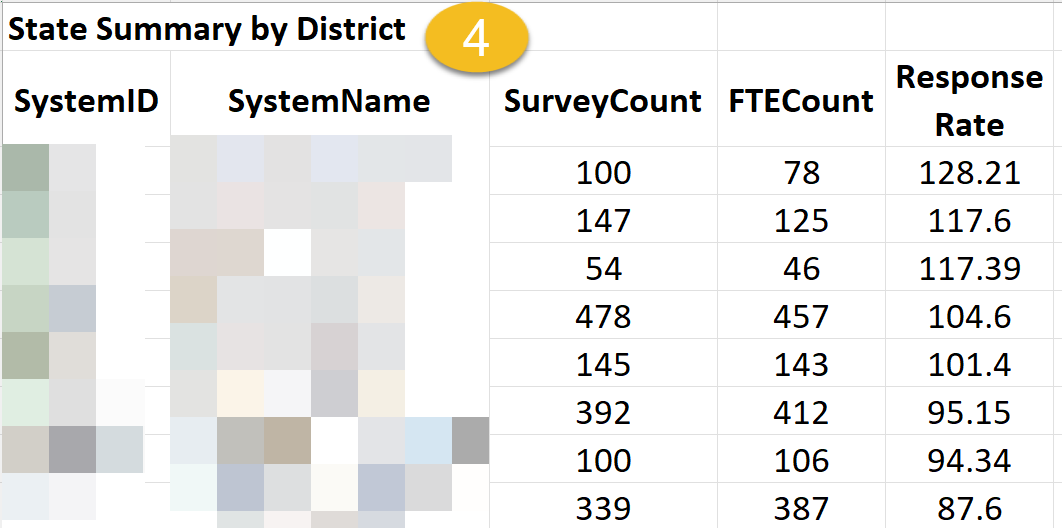
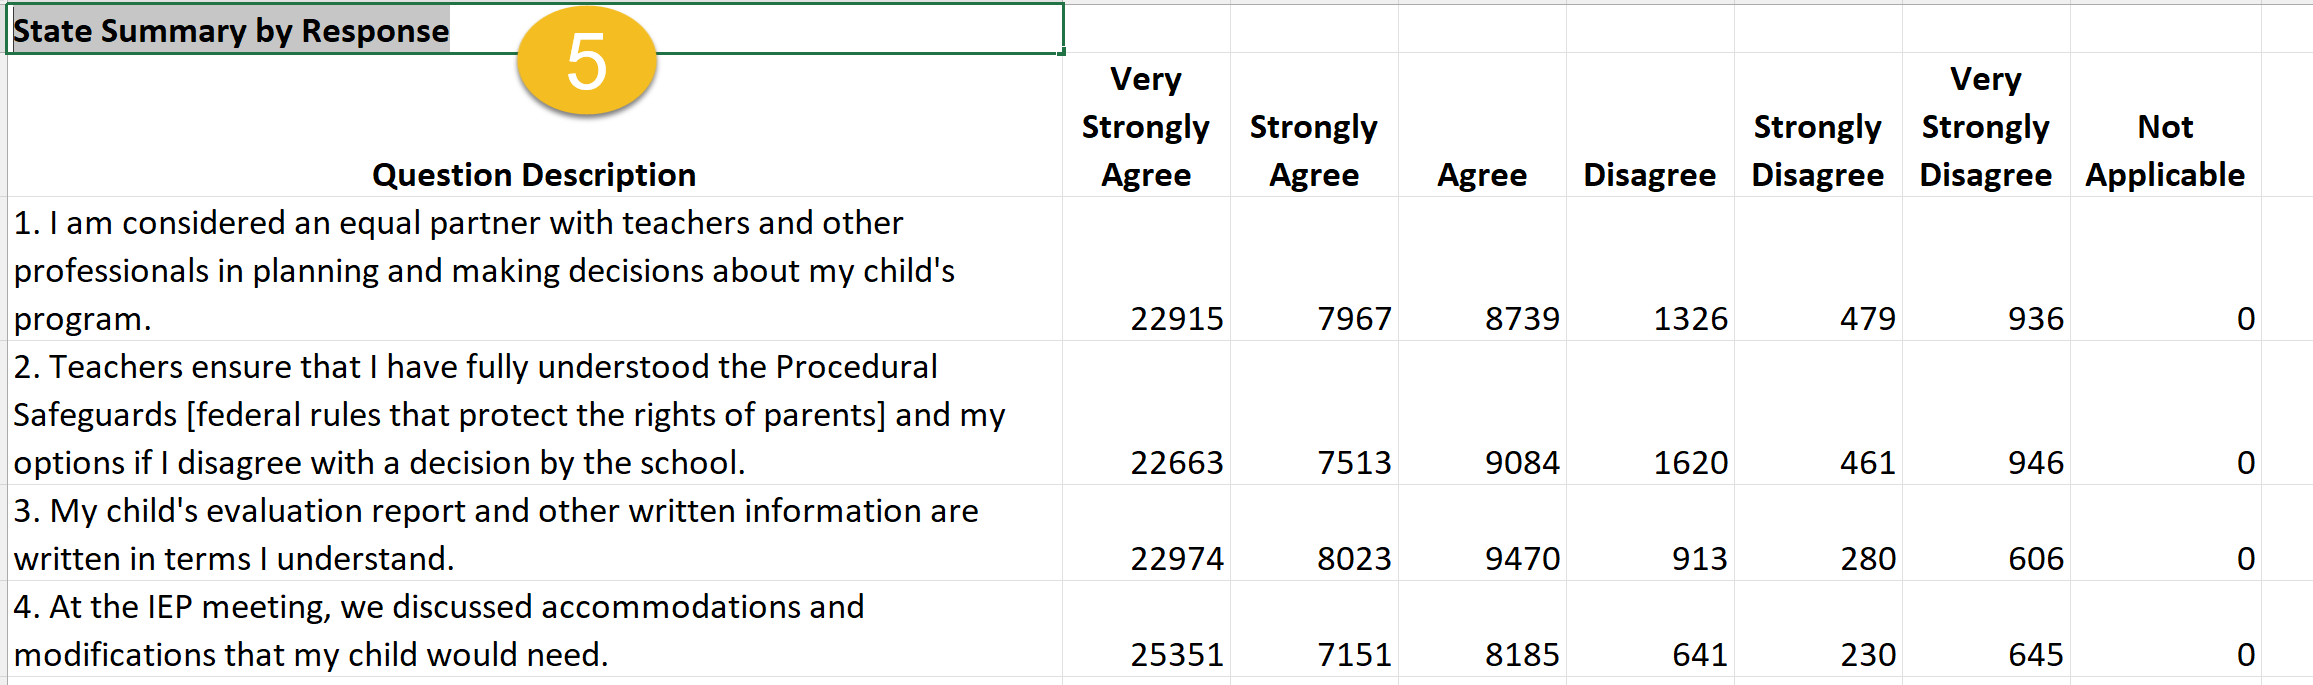
The State Summary by District (4) The State Summary by District file shows the response rate of each LEA in Georgia. The report also includes the system ID, System Name, Survey Count, and total FTE-1 count for the LEA. The Response rate is calculated by dividing the Survey Count by the FTE-1 Count of SWDs in the LEA. Because there might be more than one response for a student, the response rate could be greater than 100. The State Summary by Response (5) shows the count by LEA of surveys which reported each response rating for each survey question.
Screenshot of the State Summary by District report
Screenshot of the State Summary by Response report
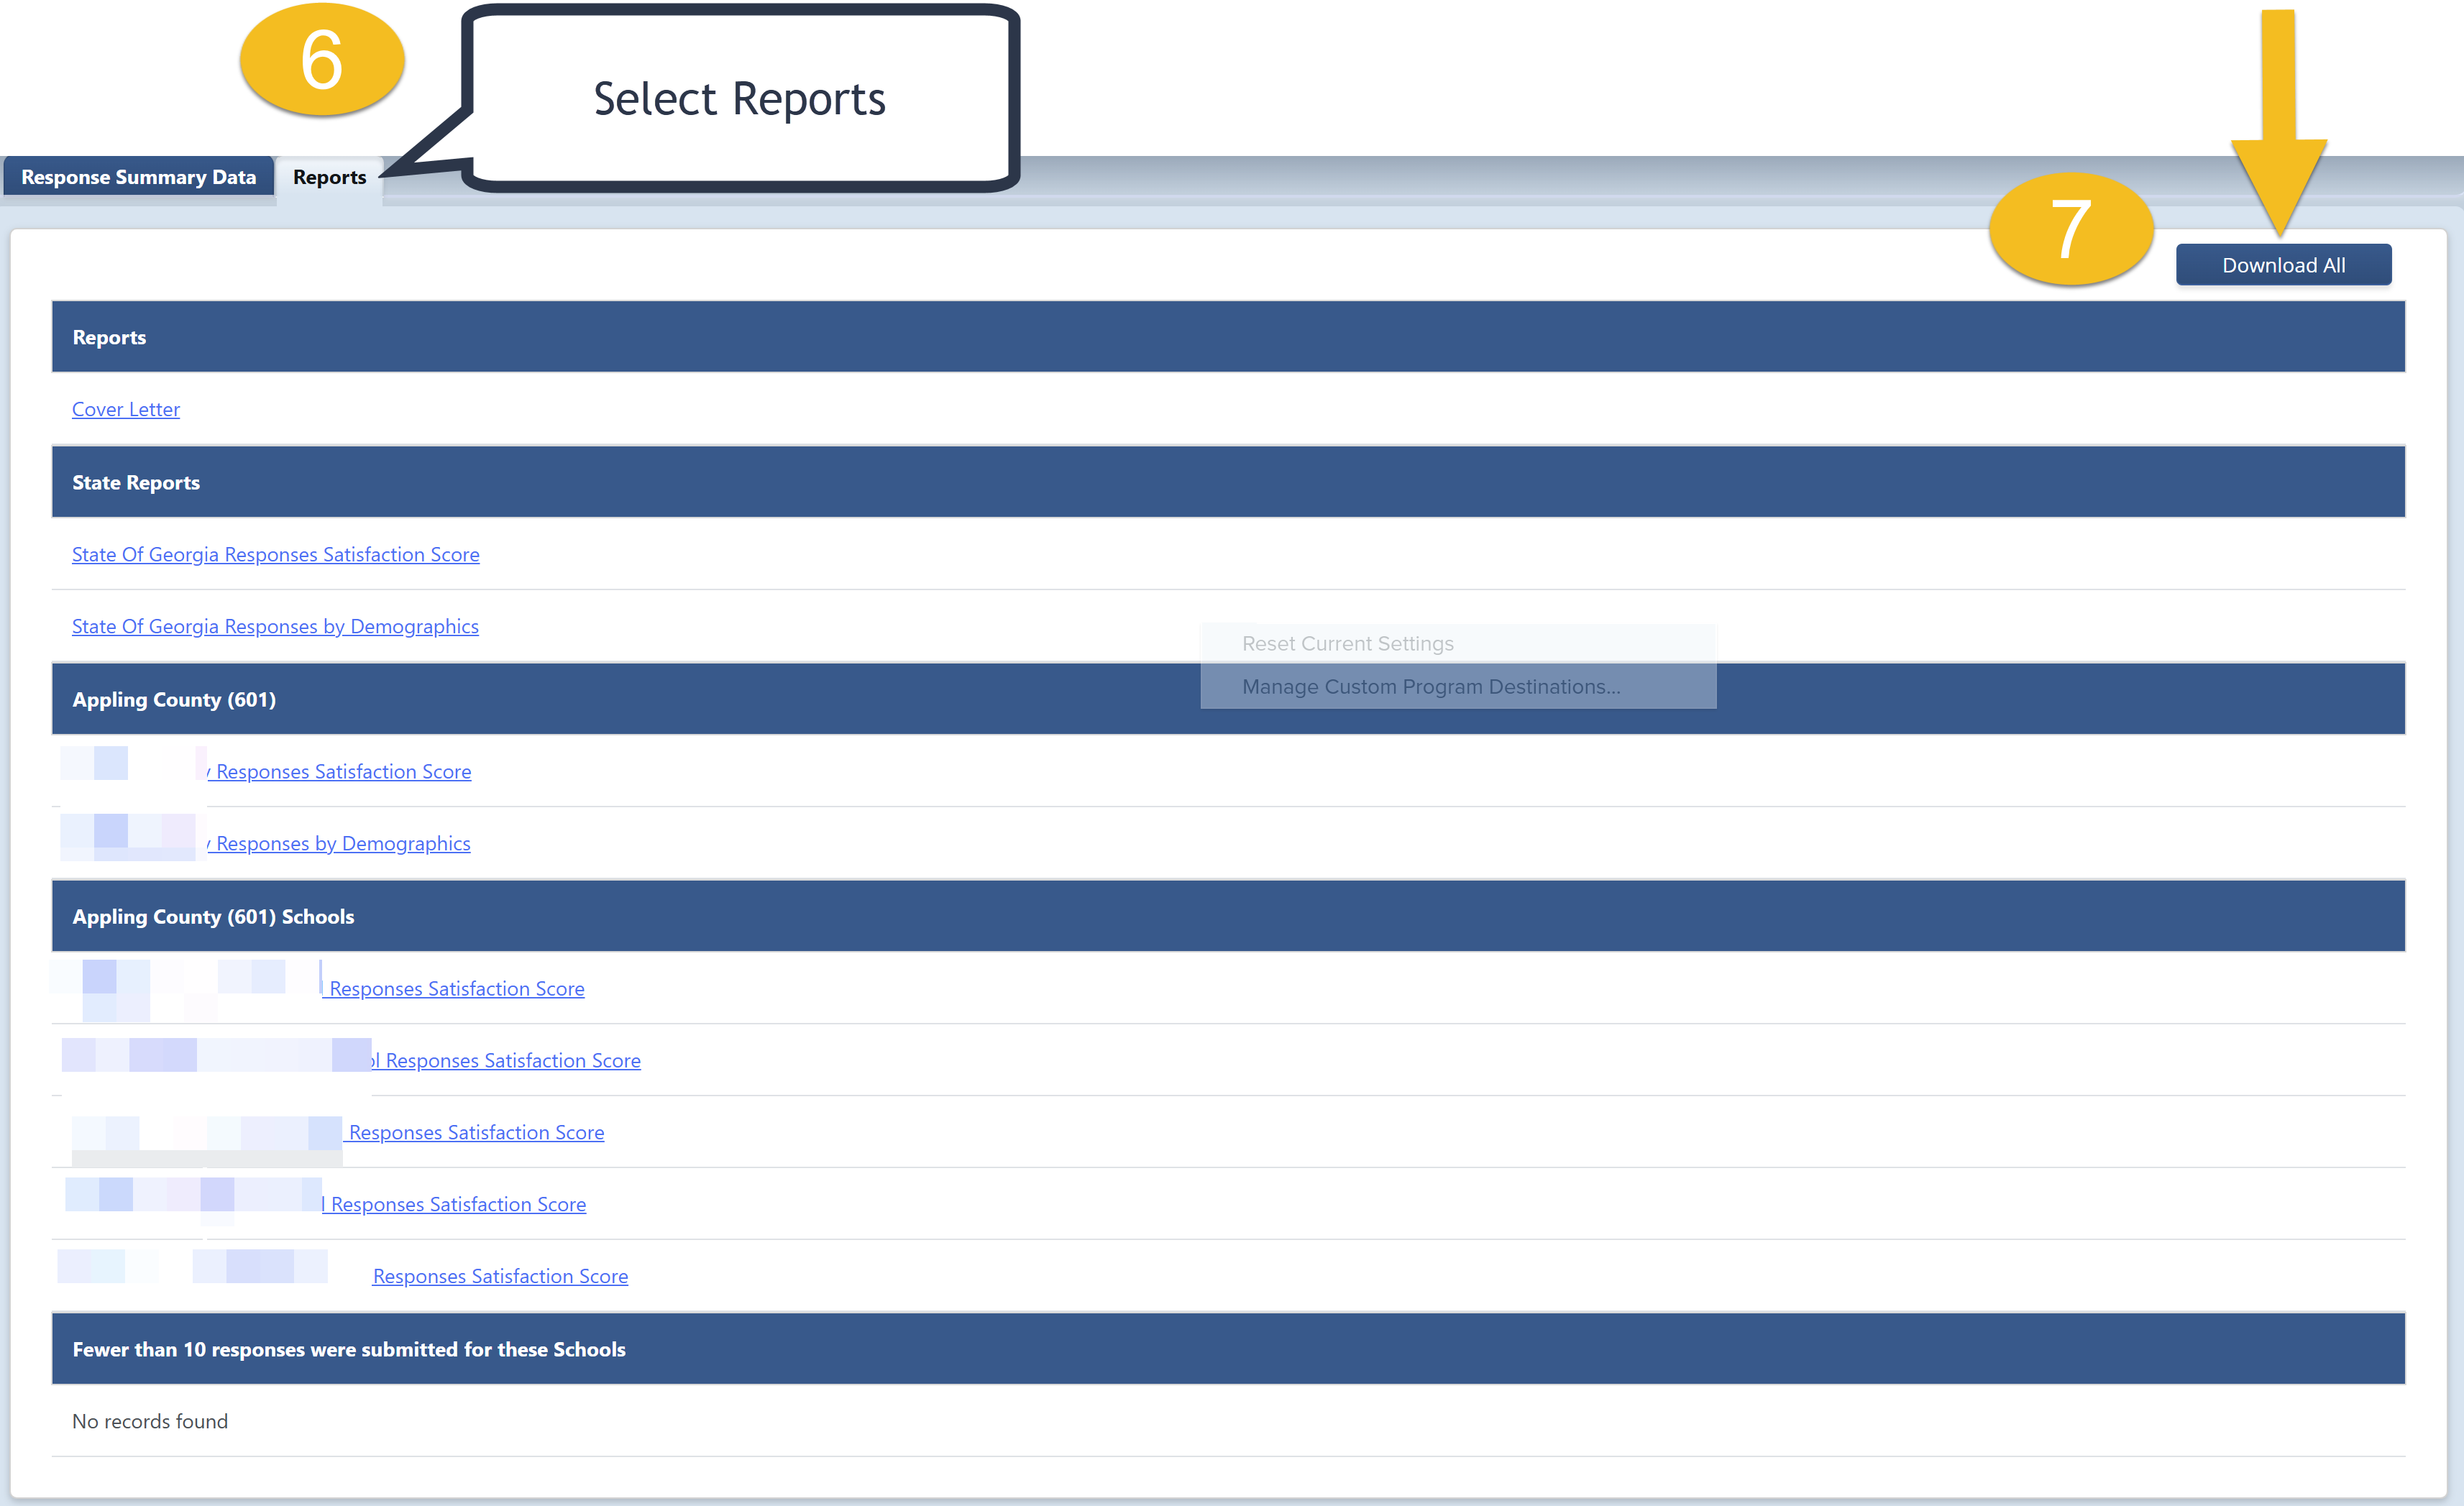
You may select the Report tab (6) to access additional information on the same page. On this tab, you can individually review several documents related to survey results from the menu. You can also click the Download All (7) button to download all reports in a zip file to your computer. Samples of each document type are provided in the screenshots below for items 8, 9, 10, 11, and 12.
Screenshot of the Reports tab
Item Mean Scores (last column for each line)
For this LEA, the count of surveys with at least one response question regarding their level of satisfaction was 153. The Response Summary Data tab showed the number of respondents who selected each satisfaction level for each question. This Excel shows the percentage of respondents who selected each satisfaction level for each question. The total percentages for each line should be close to 100% but maybe less than 100% due to rounding. When calculating the percentage and the average (mean) response for each question, any question that did not have a response was not included in the calculation.
To determine this, use Excel with the individual survey responses. Use the find/replace function in Excel to change word phrases to numbers using this table. Do this in the order listed: Very Strongly Agree = 6. Then Strongly Agree = 5, then Agree = 4. Make sure you use the entire description phrase, or your calculation may be inaccurate.
|
Numerical Scale for Ratings |
|
|
Very Strongly Agree |
6 |
|
Strongly Agree |
5 |
|
Agree |
4 |
|
Disagree |
3 |
|
Strongly Disagree |
2 |
|
Very Strongly Disagree |
1 |
In Excel, use the formula function to average each column to obtain the Mean reflecting a level of satisfaction per question. That Mean is displayed in the final column in the screenshot above with the column header “Mean.” The responses to the ten questions of the Parent Satisfaction Survey are also ranked from the highest to the lowest ranked Mean score.
Screenshot of the LEA’s Parent Survey Report
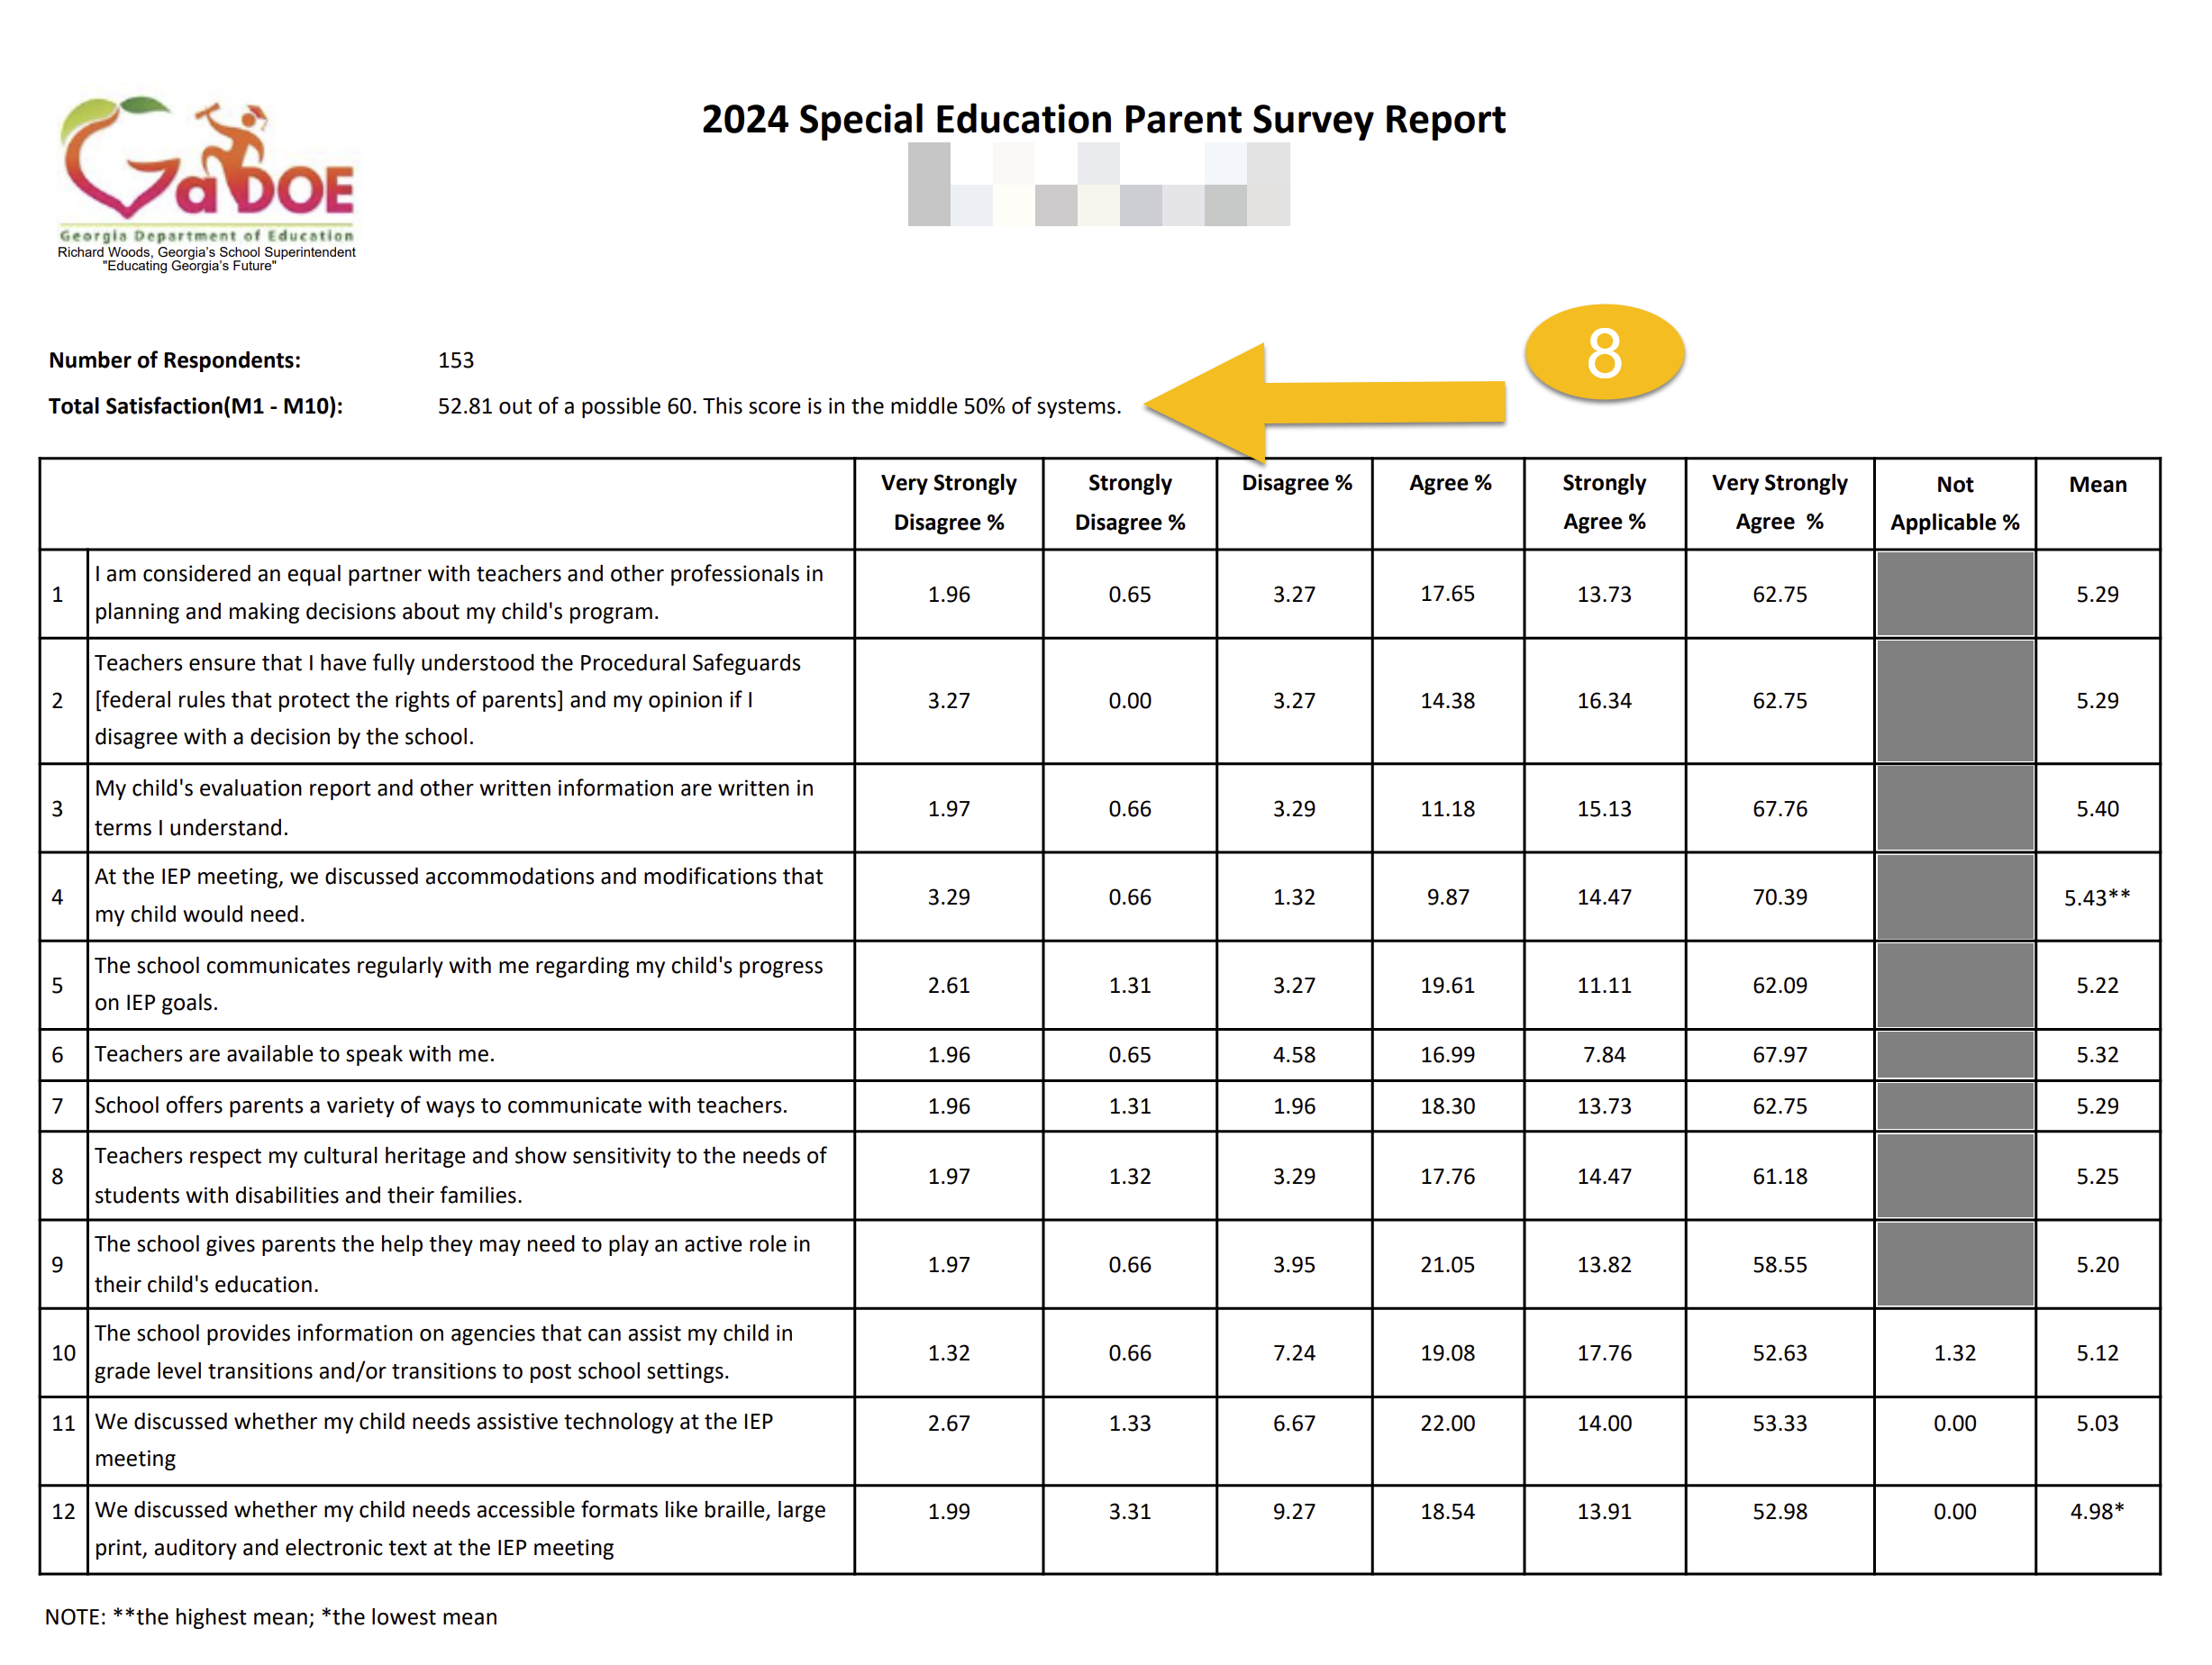
Total Satisfaction Score-displayed above in the Questions Chart (8)
Mean scores for each question (M1-M10) are added to obtain the total satisfaction score. A perfect total satisfaction score would be 60, with all ten questions answered by all respondents with Very Strongly Agree (rating of 6). The Total Satisfaction Rating in the example above was 52.81 out of a possible score of 60. All Total Satisfaction scores in the state are arranged in quadrants. Based on this system’s score, it placed it in the middle 50% (between 25% and 75%) of school systems.
Each school in the system with ten or more respondents has a separate report with the same content reflecting only the responses in that school.
Additional Report
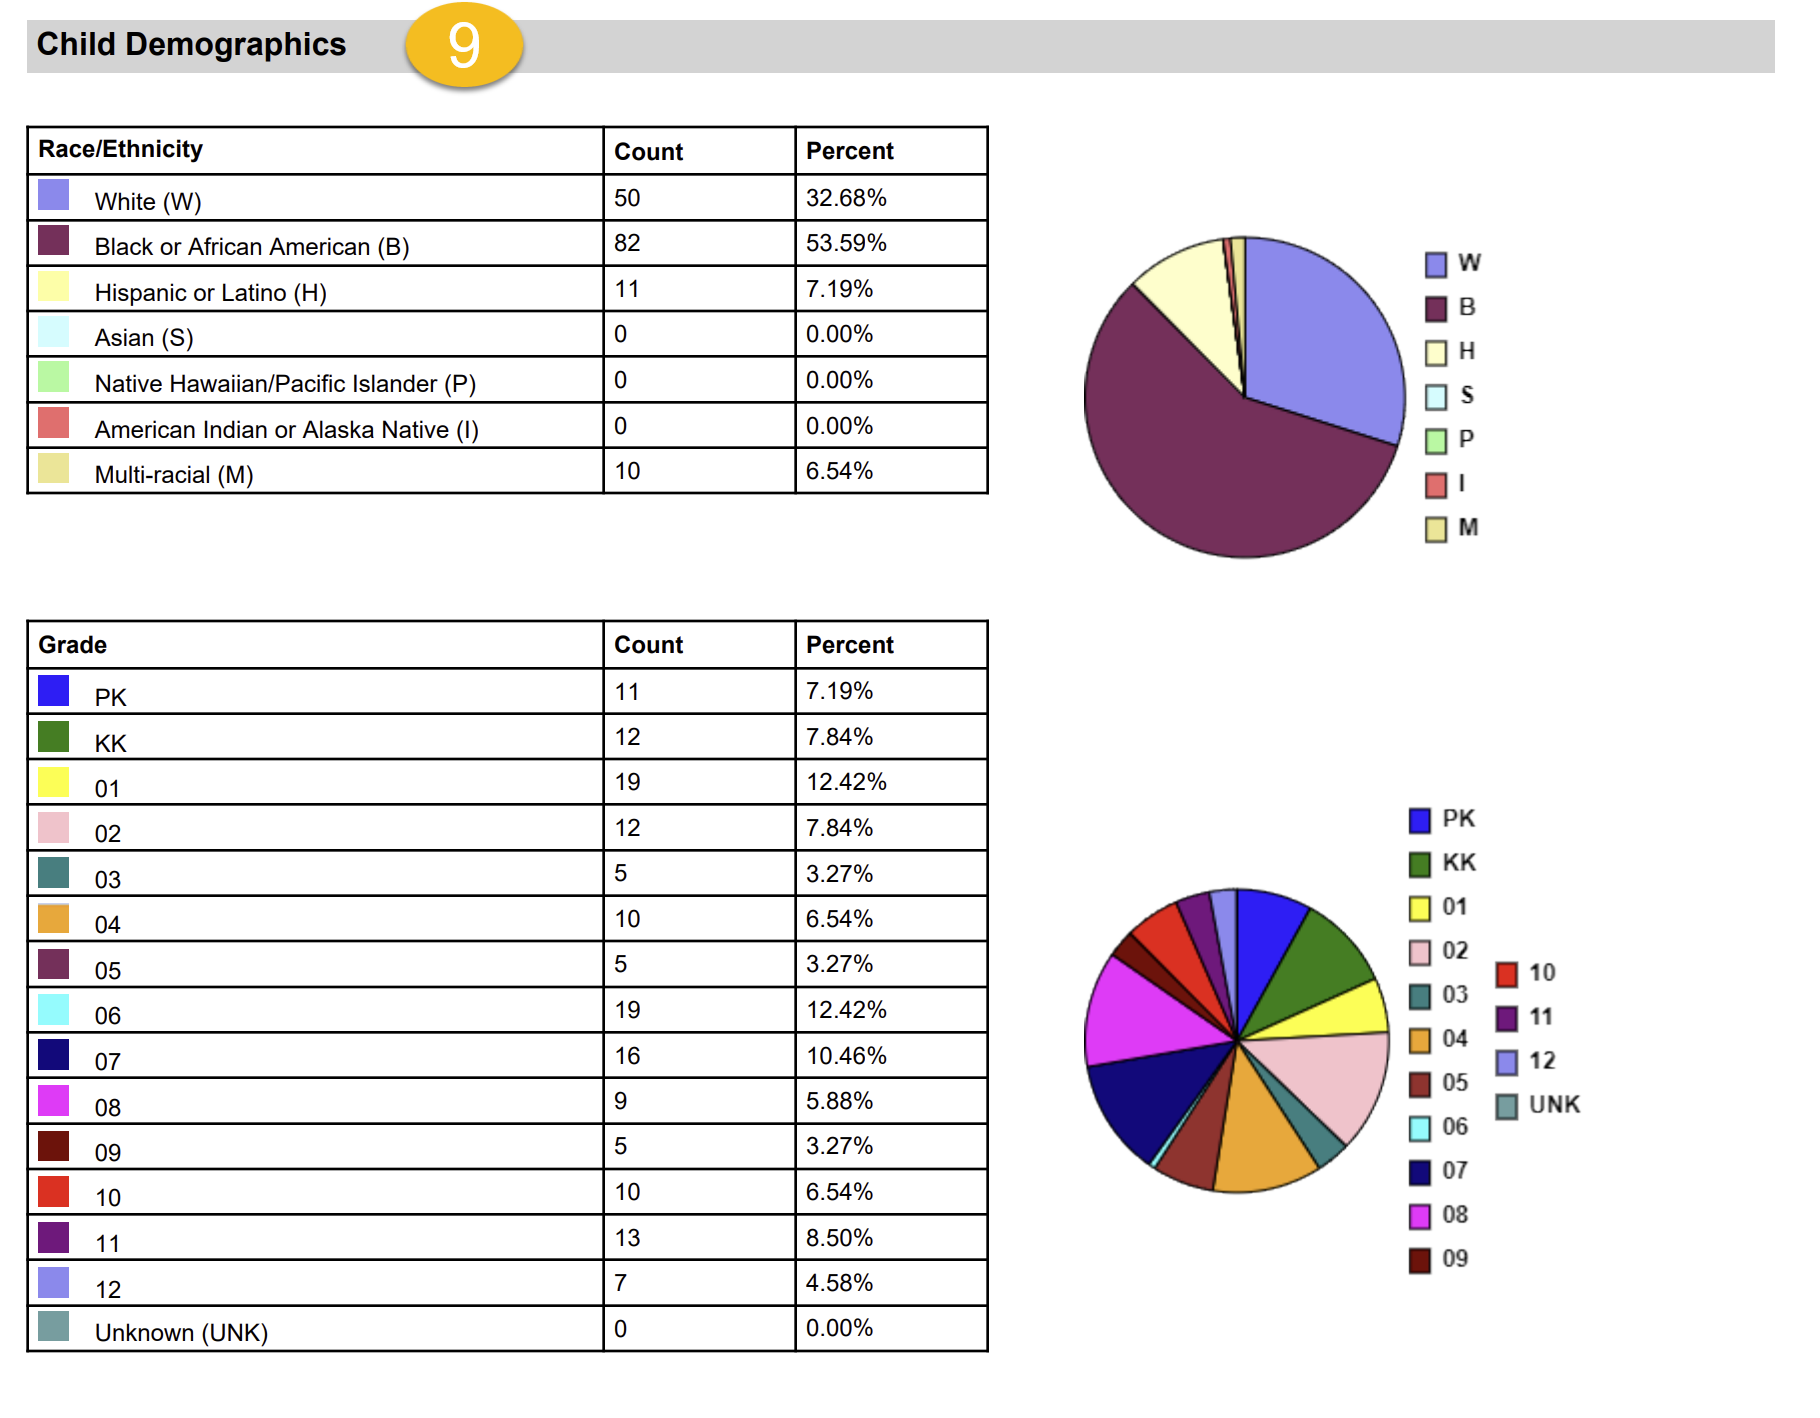
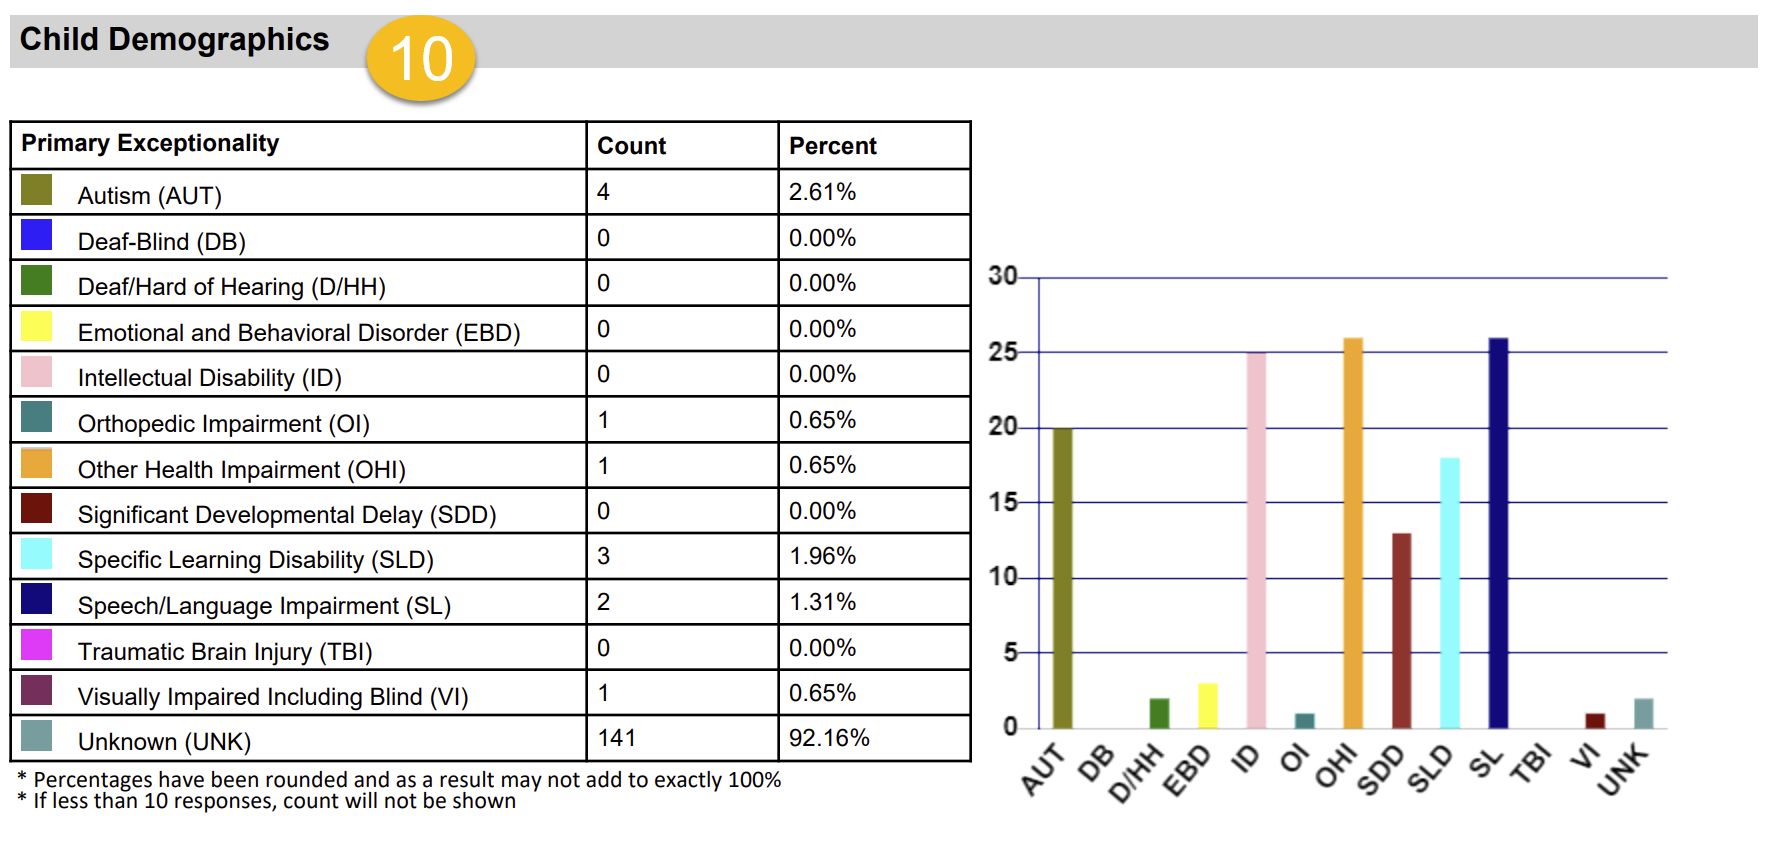
A Responses by Demographics (9) report provides the percentage of surveys submitted identifying each option for the child's race/ethnicity, grade level, and primary exceptionality (10).
Screenshot of Child Demographic report by race/ethnicity and grade
Screenshot of Demographic report by disability
Parent Satisfaction is calculated as a percentage of system surveys with responses in the agree to very strongly agree range on the survey with comparative state-level data (11).
Screenshot of Total Parent Satisfaction score
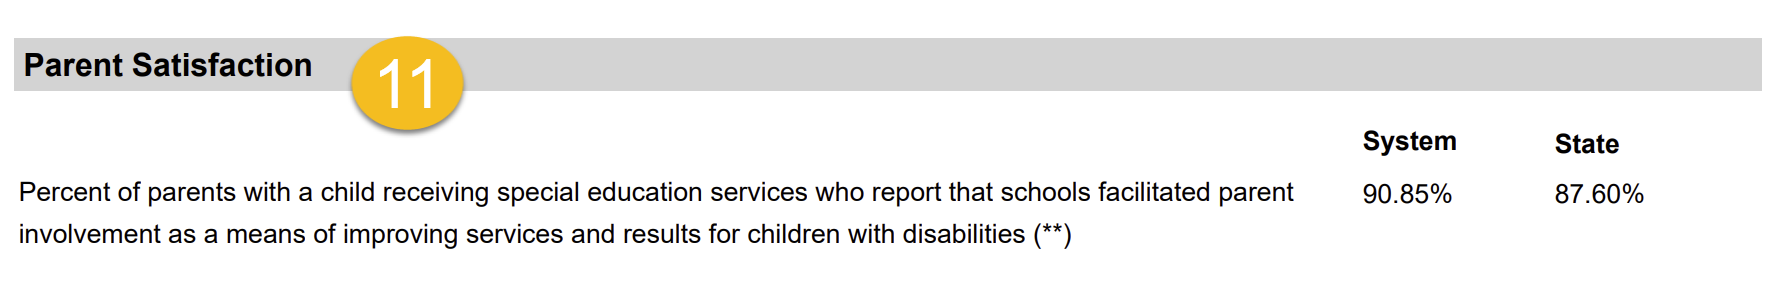
For this LEA, the percentage of surveys with a mean of 4.0 or higher was 90.85%. To determine this, use the Excel download Individual Parent Responses by Question. Do the find/replace to change words to numbers. The ratings are then averaged per parent-student survey, and the Mean for each survey is provided using this formula.
(VSA*6) + (SA*5) + (A*4) + (D*3) + (SD*2) + (VSD*1)
# of responses for the individual parent survey
Parent 1 responses:
Q1: Very strongly agree = 6
Q2: Strongly agree = 5
Q3: Very strongly agree = 6
Q4: Agree = 4
Q5: Strongly agree = 5
Q6: Very strongly agree = 6
Q7: Agree = 4
Q8: Disagree = 3
Q9: Very strongly agree = 6
Q10: Very strongly agree = 6
In Excel, sort the mean per respondent from highest to lowest. Count those with a score of 40 or higher. Divide that count by the total number of respondents to obtain the Percentage of Parents reporting that schools facilitated parent involvement.
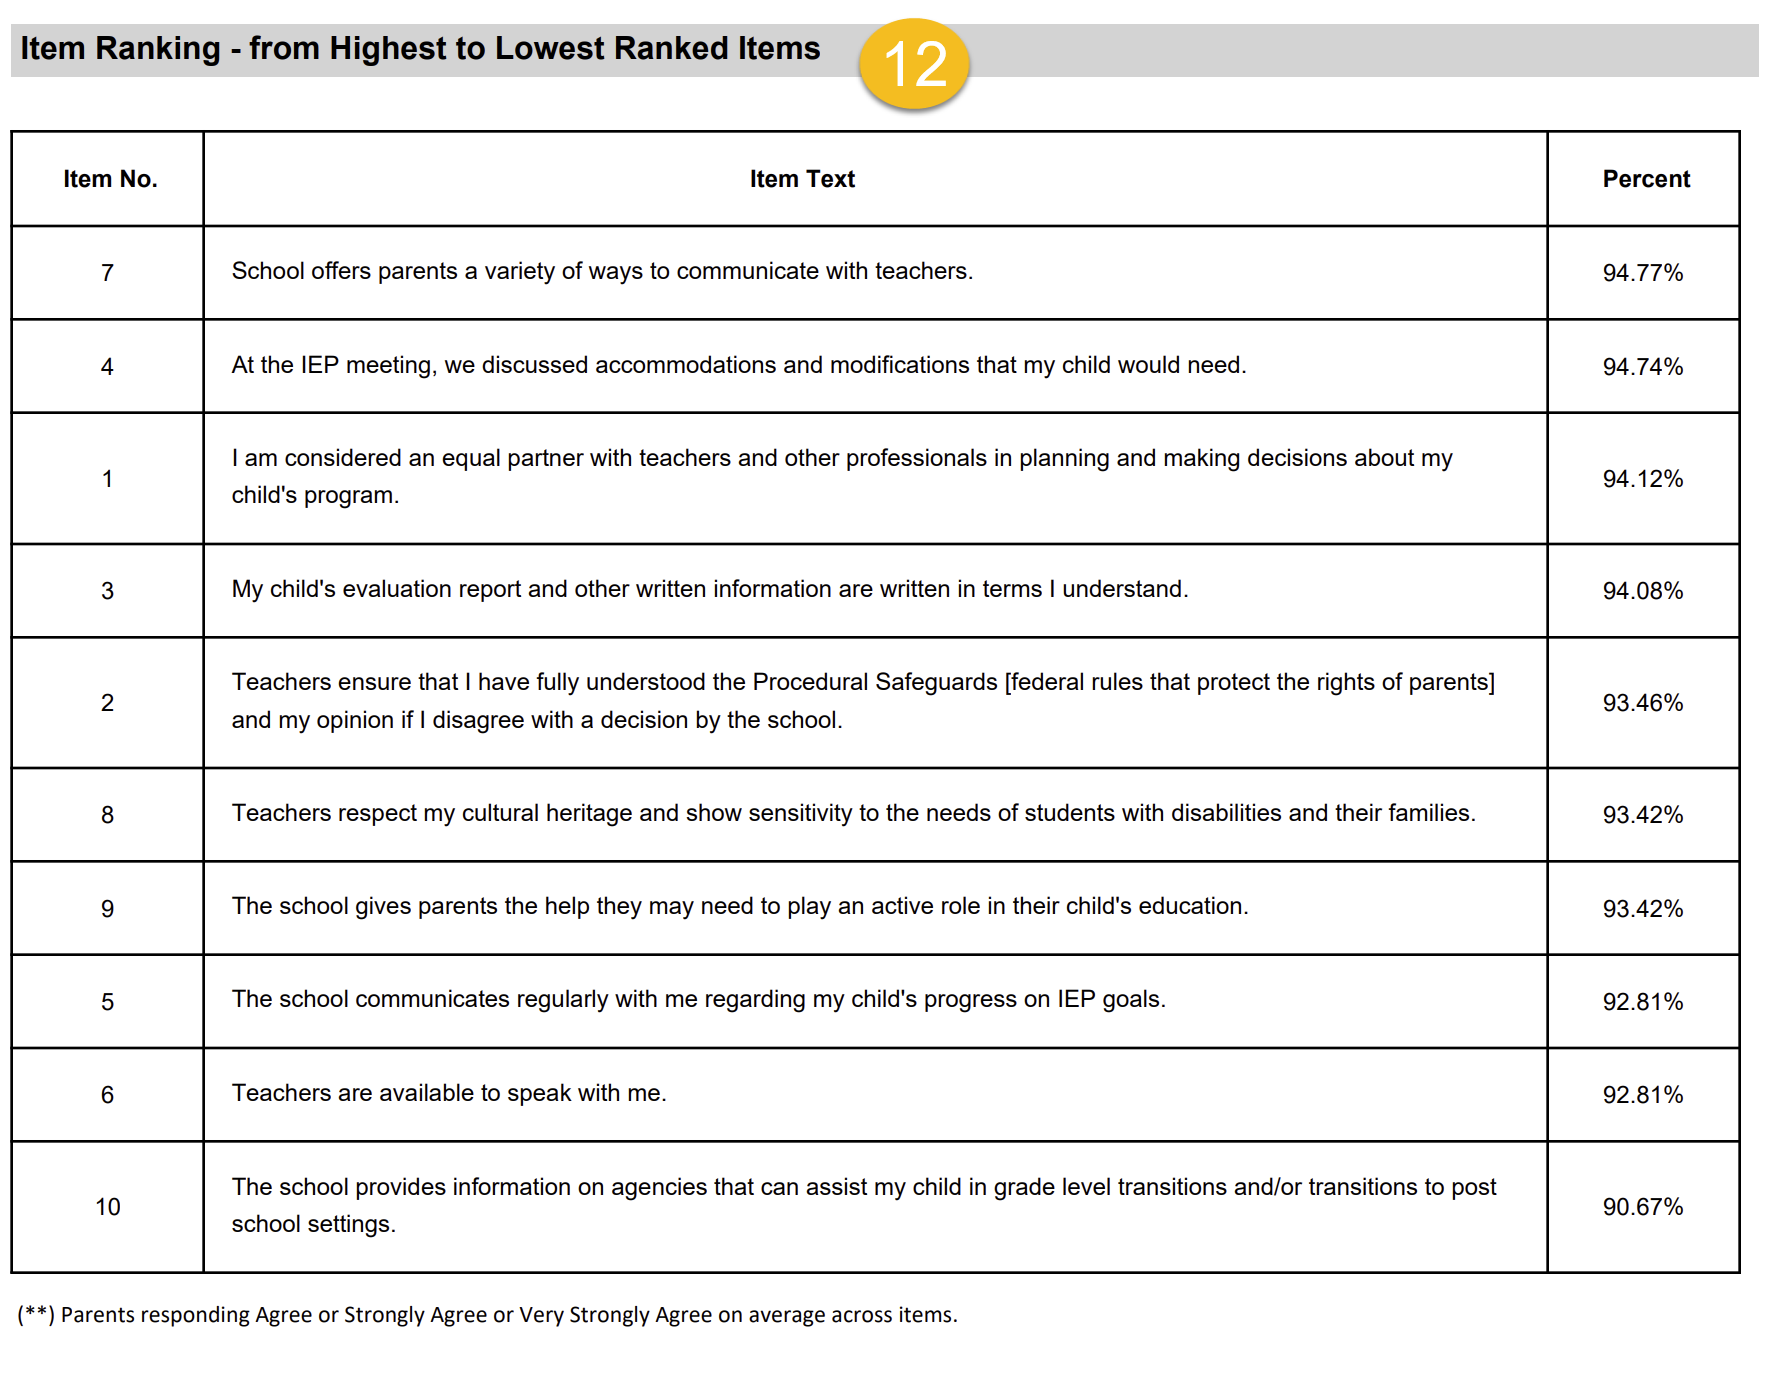
The Parent Survey Report includes an Item Ranking (12) chart showing each survey item ranked from highest to lowest for the LEA. This chart can be used for program planning to improve parent satisfaction with implementing IDEA.
Screenshot of Item Ranking by survey question