Disproportionality Application
Special Education Significant Disproportionality and Discrepancy Application
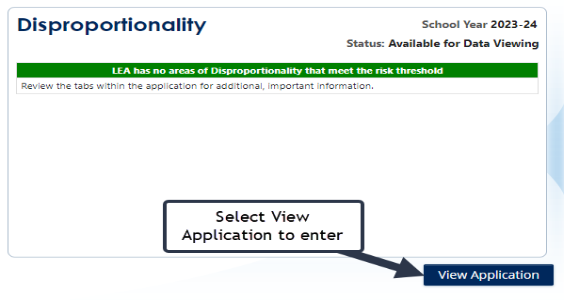
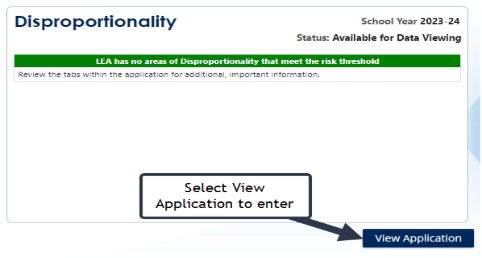
The Disproportionality application lists any areas of concern on the main tile. It is color coded to reflect the level of concern. Green indicates the LEA has no areas of disproportionality that meet the risk threshold.
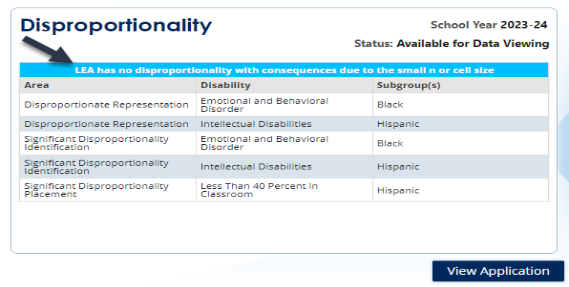
Blue indicates the LEA has areas that are over the risk/rate threshold, but the areas do not meet the cell or n-size requirements. There are too few students to determine disproportionality. These areas should be monitored. Do not ignore your blue subgroups.
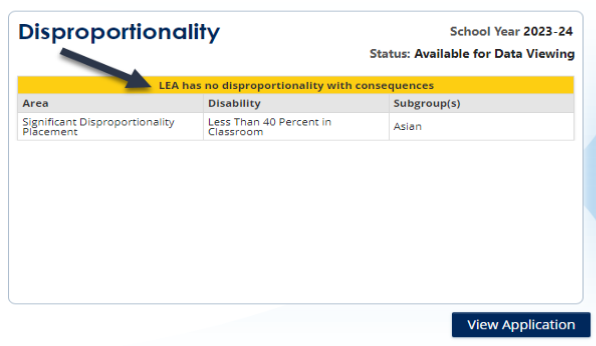
Yellow indicates the LEA is over the rate or risk ratio for at least one year, possibly two years. If the LEA continues to be over the threshold in the areas listed, the LEA will be disproportionate in either one- or two-years’ time. Immediate action is needed to prevent disproportionality.
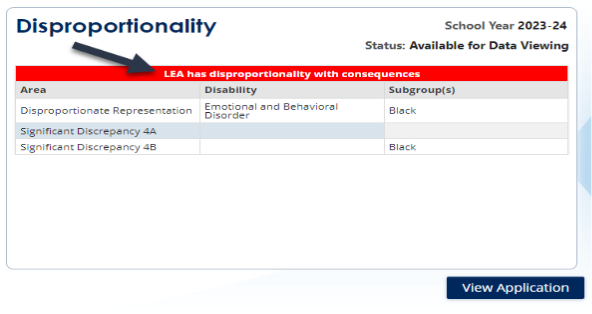
Red indicates the LEA is disproportionate. Consequences will be imposed.
Entering the Disproportionality Application
Log into the GaDOE web portal. On the left side of the portal, select the SE Applications Dashboard tab. Then scroll until you see the Disproportionality tab. Select View Application.
Once you enter the Disproportionality application, you are on the landing page with 10 disproportionality tabs that display all your LEA’s information.
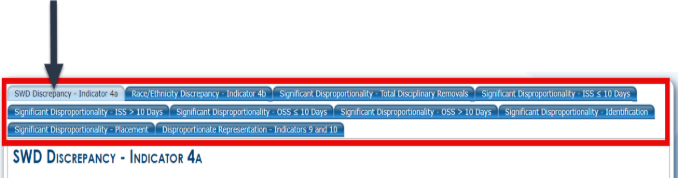
SWD Discrepancy- Indicator 4a
Race/Ethnicity Discrepancy- Indicator 4b
Significant Disproportionality - Total Disciplinary Removals
Significant Disproportionality - ISS ≤ 10 Days
Significant Disproportionality – ISS > 10 Days
Significant Disproportionality – OSS ≤ 10 Days
Significant Disproportionality – OSS > 10 Days
Significant Disproportionality – Identification (All Disabilities, Autism, Emotional and Behavioral Disorder, Intellectual Disabilities, Other Health Impairments, Specific Learning Disability, and Speech-Language Impairment)
Significant Disproportionality – Placement (Less than 40% in Classroom & Separate Settings by Race/Ethnicity)
Disproportionate Representation – Indicators 9 and 10
Each tab has a chart with the determination for that category and/or subgroups. The previous years included in the Disproportionality Determination are listed. The information in each tab is color coded to assist LEA’s with accurately reading the data provided.
- Red: Consequences imposed
- Yellow: Caution, approaching disproportionality
- Blue: No consequences, cell or n-size is too small
- Green: No area meets the risk threshold